Thursday, June 4, 2015

Malware Persistence With HKEY_CURRENT_USER Shell Extension Handlers, No Admin Required


This content has moved to http://oalabs.openanalysis.net/2015/06/04/malware-persistence-hkey_current_user-shell-extension-handlers/


Update June 8, 2015: Harlan (@keydet89), of Regripper fame, has updated Regripper to identify this persistence mechanism. Details can be found on his blog. On a related note, Harlan takes requests for Regripper features! He was pretty awesome about turning this one around quickly so if you need a new feature just e-mail him.

I was recently exposed to a new (to me anyway) method of persistence that the Bedep malware is using. The novel aspect of this persistence method is that it doesn’t require administrator rights and it evades my two favourite persistence detection tools: Autoruns, and RegRipper. The persistence method requires the creation of a per-user shell extension handler where the shell handler DLL is the malware that requires persistence. 


Known Methods of Persistence Through Shell Extension Handlers

Using a shell extension handler is actually a fairly well known, and well documented trick that malware uses for persistence. However, there seems to be a gap in the tooling provided to detect this persistence (autoruns, regripper); these tools focus on detecting Shell Extensions that have been registered for all users on the host. If a Shell Extension is only registered for a single user (Current User) it can evade detection.

What Is a Shell Extension Handler?

Explorer.exe is what is referred to as the default “shell” for Windows; it is the GUI that is used to interact with the OS. Explorer provides the ability to extend its functionality using COM objects called Shell Extensions. To quote this excellent article on building shell extensions "a shell extension is a COM object that adds features to Explorer”. 

A common example of a Shell Extension would be the “WinZip” options that appear when you right click on a file after installing the WinZip program.

WinZip Shell Extensions in action
While we won’t get too deep into how a Shell Extension is developed it is important to note that essentially it is a COM object that implements custom functionality based on a defined Interface. The COM object is then loaded into Explorer.exe as an in-process server . This is basically just a DLL that is is running inside the process space of Explorer.exe.

Registering a Shell Extension Handler

Shell Extensions need to be registered with the Shell before they can be used. How they are registered is the key to this stealthy persistence mechanism. There is a good overview of how to register a Shell Extension on MSDN. Some excerpts from that article have been copied below to quickly illustrate how a Shell Extension might be registered.

Step 1 - CLSID and Path To DLL

First the Shell Extension handler has to be assigned a unique GUID called CLSID. Then the CLSID is added to the registry HKEY_CLASSES_ROOT\CLSID and the InprocServer32 key is added signifying that this is an in-process server. The default value for the InprocServer32 key is set as the path to the Shell Handler DLL.

Add Shell Extension CLSID to registry with DLL location.

Step 2 - Assigning the CLSID to File Type or Shell Object

Once the Shell Extension has been associated with its CLSID the CLSID needs to be associated with a File Type or a Shell Object that it is going to provide extra functionality for. This is done by adding the CLSID as a key to the registry HKEY_CLASSES_ROOT\<ProgID>. In this example the CLSID will be added as a ContextMenuHandler to all File Types associated with MyProgram.

Associate CLSID with MyProgram.

Step 3 - Approving CLSID for Use

If the EnforceShellExtensionSecurity key has been set then the CLSID will need to registered as Approved before it can be used. Since the EnforceShellExtensionSecurity value may be set per-user instead of globally it is best practice to add the CLSID to HKEY_LOCAL_MACHINE\Software\Microsoft\Windows\CurrentVersion\Shell Extensions\Approved key by default.

Add CLSID to approved Shell Extensions.

The Trick is HKEY_CLASSES_ROOT

The HKEY_CLASSES_ROOT key is a virtual representation of both the HKEY_CURRENT_USER and HKEY_LOCAL_MACHINE. Where settings that are global to the host (apply to all users) are stored in HKEY_LOCAL_MACHINE and settings that are specific to a single user are stored in HKEY_CURRENT_USER. More information can be found here.

The trick is that when a key is stored in HKEY_CLASSES_ROOT by default it is stored in HKEY_LOCAL_MACHINE. However, when a key is read from HKEY_CLASSES_ROOT it is read from HKEY_CURRENT_USER first and if no key exists then it is read from HKEY_LOCAL_MACHINE. This means that when a Shell Extension is registered HKEY_CLASSES_ROOT it is stored in HKEY_LOCAL_MACHINE which requires administrative privileges, and if the EnforceShellExtensionSecurity key is set then the Shell Extension must also be registered in the HKEY_LOCAL_MACHINE\Software\Microsoft\Windows\CurrentVersion\Shell Extensions\Approved key. However, when Explorer.exe loads the Shell Extensions for a user it checks the Shell Extensions in HKEY_CURRENT_USER first before checking in HKEY_LOCAL_MACHINE.

If malware wants to install a Shell Extension without administrator privileges that will run for the current user it can individually add entries for the Shell Extension in HKEY_CURRENT_USER instead of HKEY_CLASSES_ROOT. An added advantage of this is that since the Shell Extension is only registered for the current user it doesn’t need to be registered in HKEY_LOCAL_MACHINE\Software\Microsoft\Windows\CurrentVersion\Shell Extensions\Approved regardless of the setting in EnforceShellExtensionSecurity.

Here we see Bedep has taken advantage of this trick to install a Folder Extension Shell Extension handler in HKEY_CURRENT_USER. The FntCache.dll is the persistence DLL used to initialize Bedep.

Bedep Shell Extension CLSID installed in Current User.

Bedep CLSID associated as Folder Extension.

A Blind Spot in Our Incident Response Tools 

The problem with the two tools I mentioned; RegRipper (shellext.pl plugin) and Autoruns is that they rely on the Shell Extension to be registered using the standard method with HKEY_CLASSES_ROOT. Because of this they don’t individually enumerate the Shell Extensions in HKEY_CURRENT_USER. Here we see there is no trace of the Bedep persistence Shell Extension handler in the results of Autoruns on the host infected with Bedep.

Autoruns is unable to find Bedep Shell Extension.
It is interesting to note that a user on the Sysinternals forum actually complained about this issue in Autoruns back in 2007. It was based on this comment that I decided to dig into the the Shell Extensions “cached” registry key.

Building a Timeline Using Cached Shell Extensions

When a Shell Extension is loaded for the first time (per user) a key is stored in HKEY_CURRENT_USER\Software\Microsoft\Windows\CurrentVersion\Shell Extensions\Cached. More information on this registry key can be found here. We can see below that the Bedep Shell Extension CLSID has an entry in the Cached key.

Bedep Shell Extension CLSID has an entry in the Cached key.
The name of the Cached key is a combination of the CLSID of the Shell Extension, the CLSID for the Shell Object associated with the Shell Extension, and a DWORD (unknown mask value), each separated by a single space. The Bedep Cache key show above has the following parts:

Bedep Shell Extension CLSID =  {F6BF8414-962C-40FE-90F1-B80A7E72DB9A}
IDriveFolderExt CLSID = {3EC36F3E-5BA3-4C3D-BF39-10F76C3F7CC6}
Unknown Mask = 0xFFFF

The binary value that is assigned to the Cache key contains a cache control flag, some unknown data, and the time the Shell Extension was first loaded stored in 64bit little endian FILETIME.

Shell Extension Cached entry showing first loaded time.
This information can be used to build a timeline of all the Shell Extensions that have been loaded by the user when when they were first loaded.


Automated Shell Extension Timeline Generation and Shell Extension Detection 

I have built a tool (LocalShellExtParse.py) to help automate the task of generating a “first loaded” timeline for Shell Extensions and identifying Shell Extensions that are only installed for the current user. I know this probably would have been better as a RegRipper plugin but Python is the future, and we need to collect some extra information that RegRipper doesn’t currently parse.


Data Collection

This is an “offline” tool that parses entries in the NTUSER.DAT and UsrClass.dat files. To use the tool you will first need to collect the files from the host that you want to analyze. I prefer FTK Imager but any tool that allows you to carve system files will work.

Everyone knows that NTUSER.DAT is located in %userprofile% but UsrClass.dat may be less well understood. When viewing a live registry under HKEY_CURRENT_USER\Software\ there is a key called “CLSID” that shows all the CLSIDs for the current user. The data for this key is not stored in NTUSER.DAT it’s actually stored in the UsrClass.dat file located in; %userprofile%\AppData\Local\\Microsoft\Windows\UsrClass.dat.

Data Parsing

Once the files have been collected the can be parsed by LocalShellExtParse.py to produce;  
  1. a timeline of the first time each Shell Extension has been loaded by the user 
  2. a list of all Shell Extensions that have been loaded by the user and are only installed for that user.
Here you can see that it easily identified that Bedep Shell Extension.

LocalShellExtParse.py shows Bedep Shell Extension and Bedep DLL "ieapfltr.dll".

The tool can be found on GitHub here. Note* this tool has only been put through a small amount of testing, use at your own risk. This tool should only be used to prove the existence of a persistence mechanism via a per-user Shell Extension. Do not rely on this tool as proof that no persistence mechanism exists.


Conclusion

Though this persistence mechanism isn't really stealthy it still managed to elude my favourite persistence detection tools and it's something I hadn't seen before. My hope is that a check for HKEY_CURRENT_USER Shell Extensions is added to Autoruns. Until then you can use the LocalShellExtParse.py tool, pull requests welcomed.


Friday, November 7, 2014

Exposing Malware In Hidden Desktops Using CmdDesktopSwitcher


This content has moved to http://oalabs.openanalysis.net/2014/11/07/exposing-malware-in-hidden-desktops-using-cmddesktopswitcher/


Have you ever come across malware that has opened a window that you just can’t see? You suspect it is a case of the malware setting the window as hidden. You fire up WinLister to enumerate the windows in the hopes of finding the hidden window but nothing shows up. If you have ever found yourself in this situation you may be dealing with malware that is hiding in a second desktop. In this article we will walk through the process of identifying extra desktops and switching between them with a new tool called CmdDesktopSwitch.exe. 

Forget this article just let me download the tool!


What is a Desktop
We are all familiar with the term “desktop” as the main graphical window in Windows however the term isn’t just a concept it is actually an object that can be programatically manipulated. Basically a desktop is an object used to create and manage windows. Microsoft actually does a much better job of describing it than me which you can read here. The name of the default desktop that everyone is familiar with is Default. Windows also creates a desktop called Winlogon that is used for the logon screen.

The important thing to remember is that you can programatically create more than one desktop. This is a bit strange since Windows does not provide any native tools for desktop manipulation; all desktop creation and management must be implemented in third-party code. As a result not many people are aware that more than one desktop can exist per user. This makes desktops a perfect hiding place for malware. The Volatility folks have a nice post explaining the malicious uses of desktops http://volatility-labs.blogspot.ca/2012/09/movp-13-desktops-heaps-and-ransomware.html.


Malware Hiding in a Desktop
Before we get into hidden desktops let's illustrate the difference between a hidden window and a window opened in another desktop. A hidden window is simply a window that has been initialized as hidden using the SW_HIDE flag (note there are other ways to hide a window after initialization but this is the method I have seem most commonly used by malware). 


As shown in the example above the hidden window belonging to process HiddenWindow.exe is correctly enumerated by WinLister. WinLister can be used to then change the visibility of the window and make it visible. This is a useful tool that can be used to show you what the malware is doing visually. 

However, if the malware creates a new desktop and opens a window in the new desktop the window will not be enumerated by WinLister and will remain invisible. 


In the above example the process DesktopWindow.exe has created a new desktop and opened a window in it. As we can see this window is not enumerated by WinLister and remains hidden. 


Using CmdDesktopSwitch to Display Hidden Desktops
I have developed a small tool that can be used to enumerate all desktops and provides the ability to switch between desktops. The tool will first print a list of desktops it has enumerated.


As seen in the example above the process VirutalDesktopWindow.exe has created another desktop called hidden_desktop. The CmdDesktopSwitch tool has listed this desktop along with the other default desktops. We can now enter the selection number for the hidden_desktop and the tool will switch to that desktop.


As shown above the tool has switched the view to the hidden_desktop desktop and we can see the previously hidden window belonging to the VirtualDesktipWindow.exe process. We also see a popup box that the CmdDesktopSwitch tool inserts into the desktop allowing us to switch back to our default desktop (and exit tool).


How Robust Is This Tool?
This tool was mainly developed to be used in the lab not during live response. The tool operates in user land and calls the windows API so it is vulnerable to all the usual hooking techniques used to hide malware. It also only enumerates desktops on the window station that the default desktop is assigned to. The tool can certainly be used during live response but due to these limitations it should only be used to prove a positive (ie. there is malware) and never relied on to prove a negative (ie. there is no malware). 

During live response I highly recommend using the Volatility deskscan plugin and a memory dump to enumerate all desktops. Below is the output from the Volatility deskscan plugin run on a memory dump from our above example with the VirutalDesktopWindow.exe  process.


As you can see Volatility has identified the hidden_desktop and listed the VirutalDesktopWindow.exe window that is a descendent of that desktop.


Why Use This Tool?
As mentioned above Volatility does a much more thorough job of enumerating desktops however if a memory dump is not available and live response is required the tool could be used. Where it really excels though is during malware analysis. You can use the tool to visually watch malware operate. This is especially useful in the case of ad-fraud malware where the malware has opened a browser on a hidden desktop and is using the browser to defraud advertisers. By using this tool you can actually see what the malware is doing, what ads it is loading, etc.


What To Look For In Your Sandbox - IOCs
If you are analyzing a malware sample and you see the following windows API calls in your sandbox it might be time to give this tool a try.
  • GetProcessWindowStation
  • CreateDesktop
  • CreateDesktopW
  • GetThreadDesktop
  • SetThreadDesktop
  • CloseDesktop
  • CloseWindowStation


Download
You can download the tool and the source code from github

Saturday, September 6, 2014

Crowdsourced Malware Triage


This content has moved to http://www.openanalysis.net/#training


This is the long annotated version of a short presentation I put together outlining the the crowdsource tools I have used in the past for malware triage.

Not to be confused with malware reverse engineering, malware triage is a function of an enterprise Incident Response program (or in a large enterprise a SOC). The purpose of malware triage is to gain a quick broad understanding of what type of exposure your organization has when dealing with a new threat.

In an enterprise environment you may fined yourself in a situation where you need to perform a malware triage but you simply don't have access to the tools you need (sometimes this the result of your GRC approvals lagging behind technology or you may simply be in the early stages of building your Incident Response program).

In these situations you will need to rely on online tools. You can perform most malware triage simply by using a notepad, web browser, and the internet.

Pro tip: Instead of using notepad.exe try using OneNote http://www.onenote.com/ or EverNote https://evernote.com/ and keep all of your notes from past triages. This will provide a central repository that you can search and use to provide insight into future malware .triage  

 The crowdsource tools we will look at are a mix of tools specifically aimed at Incident Responders (such as crowdsource intelligence offerings) and tools that are just useful during the triage process if we don't have a local equivalent handy.

It should be noted that even with a completely vanilla Windows 7 install and application whitelisting many of these tools can be created locally through the use of PowerShell. However, for the sake of this presentation we will try to accomplish all analysis with online tools.

Obviously by their very nature these tools do not support strong operational security practices! If you are trying to avoid tipping off an adversary that you are investigating them, don't use these tools.

Pro tip: If you don't have the local tools/lab you need and you are trying to analyze an APT you have already lost. This presentation is not for you.

The scenario we will use as our demo involves receiving an e-mail with a suspicious link in it. We want to triage that URL.

Pro tip: you will note that in the screen shot it appears as though we are drafting the suspicious e-mail not receiving it... maybe we are... maybe I was tired when I took the screen shot... maybe we should move on...

 The triage workflow that we will be using to analyze the URL.

During the passive analysis phase we try to gather information about the URL without actually interacting with it. This is one of the areas that tools specific for Incident Responders have really improved in the past few years. There are tons of tools available, I've just listed the ones I use daily.  

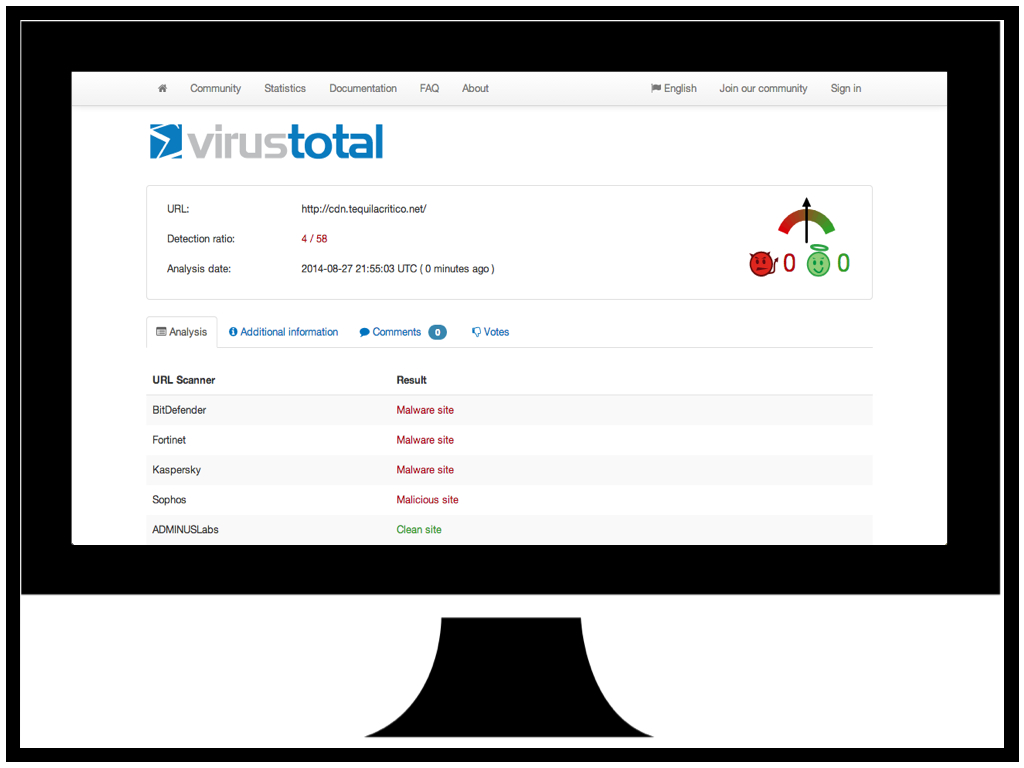
We are all familiar with https://www.virustotal.com/ so not much needs to be said here.

The URL we are triaging certainly looks malicious...

BlueCoat offer this great service https://sitereview.bluecoat.com/sitereview.jsp that will provide a "classification" for a domain you are interested in. In addition to classifying malicious domains they will also provide information on domains that are serving potentially unwanted software and adware.

Again BlueCoat confirms that the domain for the URL we are triaging appears to be malicious.

The https://www.passivetotal.org site is resource that allows researchers and other incident responders to "tag" domains with information such as the malware family they are associated with.

In this case the URL we are triaging has been tagged as "Crime" for crimeware and "Sweet Orange" possibly indicating that it leads to the Sweet Orange Exploit Kit.

The https://www.domaintools.com/ site has a suite of tools that can be used to identify the owners of domains, or group similar domains. This is a good place to start if you suspect a website has been compromised and you want to notify the owner.

In our case our URL doesn't have too much useful information but we can see that it is hosed on a shared hosting site. Possibly something to note for followup later.

Once we have gathered all the information we can from passive analysis it is time to interact with the URL.

Since we won't be using any local tools other than a web browser we will need some online tools to help us download and save a copy of the URL.

Since we won't be directly interacting with the URL using our web browser we will want to profile the user agent string so we can mirror it with our tools. Many exploit kits will deploy specific exploits based on the user agent string (and other browser features) so it is best to mimic the environment you are trying to protect. http://www.useragentstring.com/index.php is a great tool to determine what your user agent is.

 Now that we are ready to interact with the URL we want to download a copy of the page with our first interaction. Many exploit kits have a "request limit" and will stop responding after 2 or 3 requests. This is to protect the EK from people like us : )

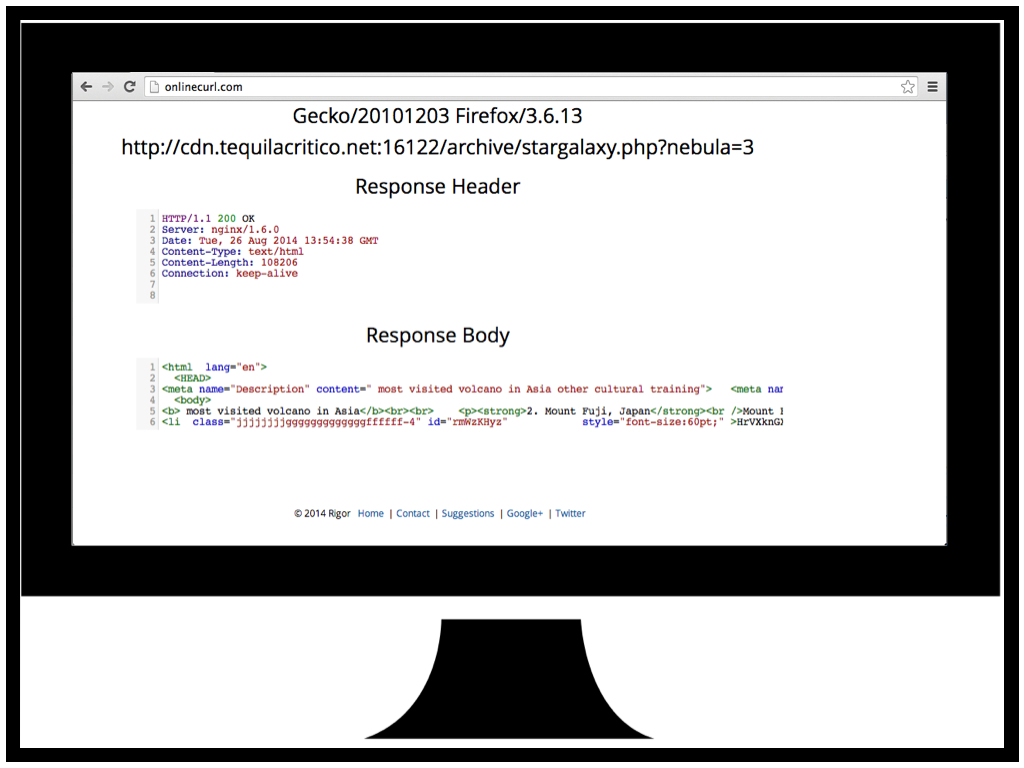
For this task we use http://onlinecurl.com/ an online version of the CURL tool everyone is familiar with. The online version has all the features of the cli version and supports options such as a custom user agent string.

We request our triage URL and we now we have a copy of the HTML code to analyze (more on this in a minute).

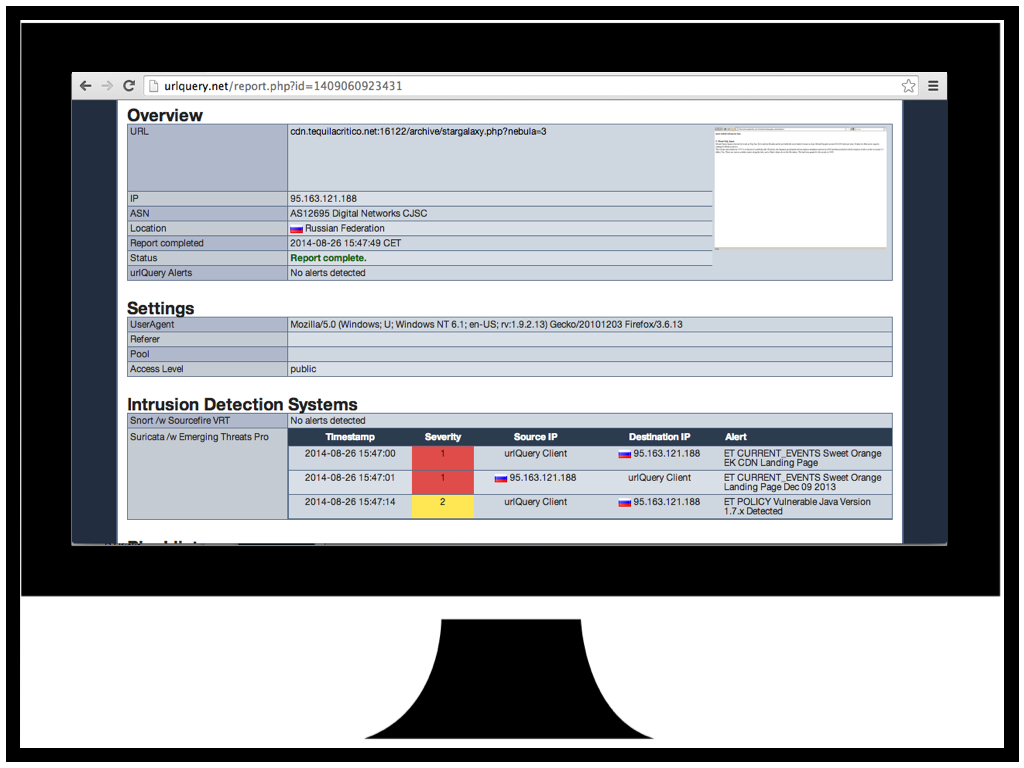
Now that we have a copy of the page and aren't worried about hitting the request limit we can try to analyze the URL with http://urlquery.net/. URLQuery is a browser sandbox that will retrieve the URL you want to analyze and run the request traffic past some IDS/IPS sensors. If the sensors detect any malicious traffic the alerts will be displayed.

I our case we can see that we have had a few IDS hits related to "Sweet Orange EK" confirming our earlier suspicion that this is the Sweet Orange Exploit Kit. We also have a hit for a vulnerable Java version check. Definitely something to keep in mind as we proceed.

Web component analysis is just fancy language for "read the HTML and JS". During this phase we just want to figure out what the page is doing. The tool you will use the most is your own understanding of HTML and Javascript. 

To help get a human readable version of the web page we can copy the code into http://jsbeautifier.org/ and have it "beautify" the code for us. This just adds line breaks and white space to make the code easier to understand.

The code for our URL is already starting to take shape. We can see there is an "<li" tag id=rmWzKHyz that looks like it has some encoded/encrypted data in it and we can see some Javascript functions that look like they may be user to decode/decrypt.

Now that it's time for us to take a closer look at the Javascript it may be tempting to just upload it to one of the many "javascript analysis sandboxes" that exists. In my experience these things never work for what we want. Keep in mind that we are truing to understand what the javascript is doing not just "is it bad".

In this case we can see that the Wepawet sandbox has identified our web page as benign when it clearly isn't.

For Javascript analysis I recommend finding an online JS interpreter instead of running the JS live in your browser. This will eliminate the risk of compromising your own workstation if you make a mistake. I prefer the http://math.chapman.edu/~jipsen/js/ online JS interpreter as it has no document object so if the JS is appending code to the document you will quickly identify this with an error.

To analyze our URL Javascript we copy it over to the JS interpreter and run it removing the final eval() statement. As we can see some new javascript is printed to the console... could this be the decrypted JS hidden in the "<li" tag?


Here I have just presented a different approach for those careless/brave enough to just run the JS in their own browser. Here we are using the Developer Tools native to Google Chrome to debug the JS.

If we copy that JS output back into jsbeautifier and clean it up we can now see something that looks very suspicious. There appears to be three different print statements and some javascript that is checking for plugins.

 If we copy the contents of the print statements and beautify them we can see there are three different possible exploits loaded one flash and two java (we don't know they are exploits but we are plenty suspicious). For the purpose of this presentation I have chosen to analyze the second java one as it provides the best opportunity to showcase the most tools.

If we look at the second java one we can see that there are some parameters that appear to be obfuscated and there is a long string assigned to the jnlp_embedded tag. It's not apparent in this slide but at the end of the string there is "==" suggesting that it might be base64 encoded.

Since we don't have any local base64 decode tools we can use http://www.base64decode.org/ to decode the string.

Here we see that the string contains a reference to the Jar (OmXIIEr.jar) and the preloader class (WxIOiLd). We can now download the Jar and start analyzing the classes starting with the preloader.

Now that we know how the exploit is going to be delivered it's time to actually analyze the exploit.

We can download the Jar file with out web browser without any risk as it is benign without the web component to load it. Once downloaded we can just change the .jar extension to .zip and use native tools to unzip it (http://en.wikipedia.org/wiki/JAR_(file_format)).

Here we can see the jar contains a bunch of class files including the preloader class and a strange file with a .qvcw extension.

Pro tip: If for some reason you don't have a native unzip tool (maybe you are using a chrome book?) there are plenty of online zip tools  http://b1.org/online.

We can also try uploading the jar to Virus Total to see what anti-virus thinks of it.

As always anti-virus working overtime with 2/55 but, one of those 2 hits gives us CVE-2013-2460. Now we have a pretty good idea what exploit is. If you want to stop here you can but I always suggest following through an verifying that the AV guys got it right. We all remember how many false positives they had on CVE-2014-1761, you would have been exposed to lots of risk if you trusted the AV signatures for that...

If you aren't familiar with the great work from Dan Guido and the Exploit Intelligence Project go check it out https://www.isecpartners.com/media/12955/eip-final.pdf. The project analyzed all major exploit kits in 2009-2010 and identified the origins of the exploits they were using. It turned out that none of them used 0-day, they all relied on exploits that had been discovered by white hats or were in published analysis of APT campaigns.

Pro tip: You have a very very high chance of finding the exploit published online if you are triaging crimeware. I like to look in the Metasploit github https://github.com/rapid7/metasploit-framework/tree/master/modules/exploits. Once you have found the exploit you are looking for you don't actually need to reverse the malware you just need to do some code comparison. This is the secret to quick triage.

For our triage we have found CVE-2013-2460 in the Metasploit github. Now all we need to do is look at the jar javacode and see if they match.


 In order to decompile the jar class files we can use http://www.showmycode.com/ an online java and flash decompiler.

Here we have decompiled the preloader class and we can see that the java code is heavily obfuscated.

The best way to de-obfuscate java code is to run it with a debugger and print statements. This requires a bit of understand of Java but it's fairly straight forward. I like to use http://ideone.com/ an online IDE, compiler, and debugger all in one, no local Java tools required.

Here we are decoding encoded strings in the Java code and printing them to stdout.

Once we have decoded all the strings in the Java code we substitute them back into the code and here we have some code that very closely resembles part of the Metasploit CVE-2013-2460.

But what about that strange file with the .qvcw extension? Here we see it loaded as a string along with the string "555546DZD2A1FD2992".

If we open the .qvcw in notepad we can see that it is a txt file with the 5555 string repeated in it a lot.

Let's use a find/replace on the 5555 string and bingo we have a serialized class.

If we deserialize the class and decompile it we are left with the other part of the Metasploit CVE-2013-2460 exploit (the part that disables the sandbox).

Pro tip: if Virus Total had not provided a CVE for us to look for we would have analyzed the exploit code as we have here but once we got to this point we would have used some of the strings from this class in Google to try and match the exploit. The reasons we use strings from this class is it has been serialized without being obfuscated so there is a good chance that it is copied code, or at lease a better chance that the order of some of the code will match a blog post or git commit.

If you are in the unfortunate position that your organization does have exposure to the exploit (perhaps you can't patch Java due to some legacy application) you will want to analyze the payload that is delivered by this exploit so you can better inform the risk function of your security program and/or sweep your enterprise for indicators.

Here we are decoding the strings that provide the URL to download the payload. Since the payload is a PE it can safely be downloaded directly with your web browser.

For the payload analysis we aren't going to go deep into malware reversing all we want to do is understand our coverage in terms of AV, identify the malware family/goals, and get some indicators in case we need to sweep our enterprise for compromises. 

The first step to analyzing the payload is to get it onto Virus Total. Not only will this give you an idea of the AV coverage but it will also submit the sample to the AV vendors so they can start generating signatures.

Here we have the AV vendors doing a spectacular job 5/55 detections and no clear indication what this malware is.

Virus Total also comes with a build in sandbox that will provide some high level indicators.

The traffic captures from the Virus Total sandbox are particularly useful for identifying the malware family using Google.

Based on these traffic samples we were able to identify this payload as Qakbot.

Hands down the best tool for analyzing binary malware is https://malwr.com/ an online sandbox. Unfortunately they recently ran out of resourced and had to temporarily stop accepting submissions. They promise to be up and running again soon.

 Other online sandboxes tend to leave something to desire. They either don't work or they are overloaded. For a long list see http://zeltser.com/reverse-malware/automated-malware-analysis.html

You can also try uploading the sample to http://totalhash.com/. TotalHash will provide you with it's own set of indicators from a sandbox run which are nice to compare with Virus Total but they will also make your sample hash searchable so that malware researchers can use it to identify groups of similar malware. It's a nice way to give back to the community and you may get some extra info.

Finally now that we have identified the malware as a variant of the Qakbot family we can go to https://www.iocbucket.com/ and search to see if there are any OpenIOCs available for the malware. IOC Bucket is a initiative to help share malware IOCs within the IR and research community.

At the time of this presentation there were no IOCs for Qakbot. If you create an IOC be sure to share it : )

Finally, most of these tools would not be possible without community involvement. If you use these tools try to give back. Even leaving comments on Virus Total helps.